
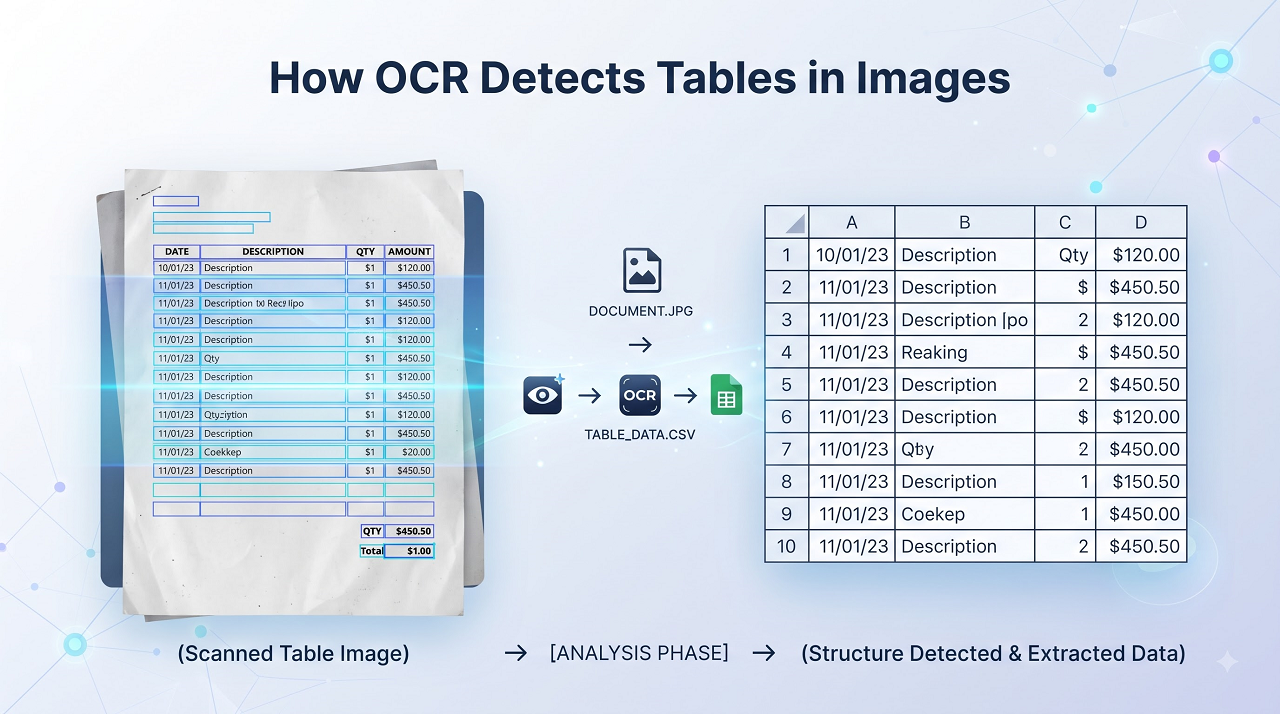
Converting text from an image is relatively straightforward for modern OCR systems.
But extracting a table from an image is a different problem.
A table is not just text. It contains relationships between headings, rows, columns, cells, and values.
For example:
| Product | Quantity | Price |
|---|---|---|
| Laptop | 2 | $800 |
| Mouse | 5 | $15 |
| Keyboard | 3 | $40 |
A basic OCR system may correctly recognize:
Laptop
2
$800
Mouse
5
$15
But recognizing those characters is only the first step.
To create a useful CSV or Excel file, the system must also determine that:
- Laptop belongs to the Product column
- 2 belongs to Quantity
- $800 belongs to Price
- the next three values belong to the second row
This is why table extraction requires both text recognition and layout analysis.
Modern document-processing systems can analyze text together with its position and document structure. For example, Microsoft’s Document Intelligence layout model extracts table rows, columns, cells, spans, and cell positions, while Google’s Document AI layout tools are designed to preserve structures such as tables, lists, and headings.
What Is Table OCR?
Table OCR refers to the process of extracting text from a table image while attempting to preserve the table’s original structure.
A normal OCR workflow may produce:
Product Quantity Price
Laptop 2 $800
Mouse 5 $15
Keyboard 3 $40
Table extraction attempts to produce:
Product,Quantity,Price
Laptop,2,$800
Mouse,5,$15
Keyboard,3,$40
The second result is much more useful because the relationships between the values are preserved.
This distinction is important when converting an image into:
- CSV
- Excel
- spreadsheets
- databases
- structured JSON
- accounting records
- inventory data
Why Is Table Extraction Harder Than Normal OCR?
An image does not contain spreadsheet cells.
It contains pixels.
When you look at a table, your brain immediately understands the structure.
You can see that:
Product     Quantity     Price
Laptop          2         $800
Mouse           5          $15
contains three columns.
An OCR system has to infer that structure from visual information.
It needs to determine:
- Where the text is located.
- Which words belong together.
- Which text is part of a row.
- Which text belongs to a column.
- Where cells begin and end.
- Which text represents a header.
- Whether some cells span multiple rows or columns.
Modern document-layout systems can represent this information explicitly. Microsoft, for example, documents table extraction with row and column indexes, row spans, column spans, cell boundaries, and header information.
How OCR Detects a Table
Although implementations differ between OCR and document-processing systems, table extraction generally involves several stages.
1. The Image Is Preprocessed
Before OCR begins, the image may be prepared to make the document easier to analyze.
Common preprocessing operations include:
- resizing
- grayscale conversion
- noise reduction
- contrast adjustment
- thresholding
- deskewing
- sharpening
- cropping
For example, if a photograph of a table is slightly tilted, correcting the perspective can make the rows and columns easier to analyze.
A blurry or poorly lit image, however, may remain difficult even after preprocessing.
This is why image quality is one of the first things to check when table extraction produces unexpected results.
For more practical advice, see How to Improve OCR Accuracy.
2. OCR Identifies the Text
The next step is recognizing the characters.
Suppose the image contains:
Product     Qty     Price
Laptop       2       800
Mouse        5        15
OCR identifies words and numbers such as:
- Product
- Qty
- Price
- Laptop
- 2
- 800
- Mouse
- 5
- 15
At this stage, the system knows what the text says.
But it still needs to determine where each piece of text belongs.
That is the difference between text OCR and structured table extraction.
3. The System Uses Text Position
OCR systems can associate recognized text with its location in the image.
Imagine the following simplified coordinates:
Product → x: 100, y: 100
Qty     → x: 300, y: 100
Price   → x: 450, y: 100

Laptop  → x: 100, y: 150
2       → x: 300, y: 150
800     → x: 450, y: 150
The actual coordinates are not important here.
What matters is the pattern.
Text appearing at similar vertical positions may belong to the same row.
Text appearing at similar horizontal positions may belong to the same column.
This spatial information helps a table-extraction system reconstruct the grid.
Modern layout-analysis systems explicitly expose positional information such as cell boundaries or bounding polygons rather than treating the document as plain text.
4. Rows Are Identified
Once the positions of recognized text are available, the system can analyze their vertical alignment.
For example:
Product    Qty    Price
Laptop      2      800
Mouse       5       15
Keyboard    3       40
The system can identify approximately horizontal groups:
Row 1: Product | Qty | Price
Row 2: Laptop | 2 | 800
Row 3: Mouse | 5 | 15
Row 4: Keyboard | 3 | 40
This is one of the key steps in reconstructing a table.
However, rows are not always perfectly straight.
A photographed document may contain:
- tilted text
- uneven spacing
- curved pages
- perspective distortion
- handwritten entries
- inconsistent row heights
Therefore, table detection cannot always rely on exact alignment.
5. Columns Are Identified
The next challenge is determining which values belong to the same column.
Consider:
Product       Qty       Price
Laptop         2        800
Mouse          5         15
Keyboard       3         40
The system needs to infer approximately:
Column 1 → Product
Column 2 → Qty
Column 3 → Price
Column detection becomes especially important when table borders are missing.
For example, a table may look like this:
Product     Quantity     Price
Laptop      2            800
Mouse       5            15
Keyboard    3            40
There are no visible vertical lines.
The structure must therefore be inferred from the positions and relationships between the text elements.
6. Table Boundaries Are Detected
A document can contain several different regions.
For example:
Invoice #10452

Customer: ABC Company

Product      Qty      Price
Laptop        2       800
Mouse         5        15

Subtotal              1,675
Tax                     167
Total                 1,842
An extraction system needs to distinguish the table from:
- document title
- invoice number
- customer information
- totals
- surrounding paragraphs
This is where document layout analysis becomes particularly useful.
Modern layout parsers can identify tables as structural elements alongside text, paragraphs, headings, lists, figures, and other document regions.
7. Headers May Be Identified
The first row of a table often contains column names.
For example:
Product | Quantity | Price
The system may identify this as a header row rather than ordinary data.
This matters because the final CSV or Excel file can then preserve:
Product,Quantity,Price
followed by the actual records.
Modern document-layout systems can provide information about whether cells are recognized as column headers.
8. Cells Are Reconstructed
After identifying rows and columns, the system can assign text to individual cells.
For example:
Product      | Quantity | Price
-------------|----------|------
Laptop       | 2        | $800
Mouse        | 5        | $15
Keyboard     | 3        | $40
The output can then be represented as:
[
  ["Product", "Quantity", "Price"],
  ["Laptop", "2", "$800"],
  ["Mouse", "5", "$15"],
  ["Keyboard", "3", "$40"]
]
This kind of two-dimensional representation is what makes it possible to generate a spreadsheet.
What Happens With Tables Without Borders?
This is one of the most common questions about table OCR.
A table does not always have visible lines.
For example:
Name       Age       City
John       31        Delhi
Sarah      28        Mumbai
David      35        Pune
There are no borders around the cells.
Yet a human can still recognize the table.
A capable table-extraction system can use the spatial arrangement of the text to infer rows and columns even when explicit borders are absent.
This is one reason table extraction is more than simply detecting horizontal and vertical lines.
What Happens When a Table Has Borders?
Bordered tables can provide useful visual clues.
For example:
+----------+-----+-------+
| Product  | Qty | Price |
+----------+-----+-------+
| Laptop   |  2  | 800   |
+----------+-----+-------+
| Mouse    |  5  | 15    |
+----------+-----+-------+
The lines can help identify cell boundaries.
However, borders do not automatically make extraction perfect.
Problems can occur when:
- lines are broken
- lines are very faint
- text touches the borders
- scanned lines are distorted
- shadows create false lines
- table lines overlap characters
Therefore, a good extraction workflow considers both visual structure and recognized text.
How Merged Cells Affect Table Extraction
Merged cells are another difficult case.
Consider:
             Sales Report
--------------------------------
Product     | Q1 | Q2 | Q3
--------------------------------
Laptop      | 20 | 25 | 30
The heading “Sales Report” may span the entire table.
A simple grid detector might interpret it as an ordinary cell.
More advanced layout analysis can represent row spans and column spans, allowing the structure to be preserved more accurately. Microsoft documents row-span and column-span information as part of its table extraction output.
Merged cells become especially important in:
- financial reports
- research papers
- business reports
- complex invoices
- government forms
- academic tables
How OCR Handles Rotated or Skewed Tables
Real-world documents are not always perfectly aligned.
A table may be:
- photographed from an angle
- scanned slightly crooked
- rotated
- printed on a curved page
Modern document-layout systems can account for rotated tables in their extraction workflows.
However, severe perspective distortion can still make extraction difficult.
For photographs, taking the picture directly above the document rather than from a sharp angle can significantly improve the starting conditions.
Why OCR Sometimes Gets the Text Right but the Table Wrong
This is one of the most important problems to understand.
Suppose the original table is:
Product     Qty     Price
Laptop       2       800
Mouse        5        15
OCR might correctly recognize every value.
But the output could become:
Product
Qty
Price
Laptop
2
800
Mouse
5
15
There may be no spelling error.
There may be no missing number.
The problem is that the relationships between the values were lost.
This is why OCR accuracy and table-extraction accuracy should not be treated as exactly the same thing.
If you are experiencing this problem, see our guide on Why OCR Fails on Tables and How to Fix It.
Why Tables in Receipts Are Difficult
Receipts are a good example of why real-world table extraction can be complicated.
A receipt may look something like:
ABC STORE

Milk              2    80
Bread             1    45
Coffee            1   220

Subtotal              345
Tax                    17
Total                  362
The product list looks like a table, but there may be:
- no borders
- inconsistent spacing
- narrow paper
- thermal-print artifacts
- faded characters
- different font sizes
- totals outside the main item structure
A table-extraction system needs to distinguish the product rows from the subtotal, tax, and total.
This is why simply running OCR over the entire receipt is not always enough.
For receipt-specific workflows, see Scan Receipts to Excel Automatically.
Why Invoices Can Be Even More Complicated
Invoices often combine several structures on the same page.
For example:
Invoice Number: INV-2048
Date: 15 September 2026

Customer:
ABC Company

Product       Qty    Price     Total
Laptop         2      800      1600
Mouse          5       15        75

Subtotal                         1675
Tax                               167
Total                            1842
There is:
- key-value information
- a table
- totals
- labels
- headings
The system needs to determine which information belongs to the table and which information exists outside it.
This is why modern document-processing systems often combine OCR with layout analysis and structured extraction rather than treating every document as a flat block of text.
For a practical invoice workflow, see Convert Invoice Images to Excel for Accounting.
How AI-Assisted Table Detection Differs From Basic OCR
Basic OCR primarily answers:
“What text is present?”
A table-aware extraction system also needs to answer:
“Where is the text, and how is it organized?”
An AI-assisted workflow may therefore combine:
Image → OCR → Layout Analysis → Table Detection → Cell Reconstruction → Structured Output
The exact implementation varies between tools.
Some systems use traditional computer-vision techniques.
Others combine OCR with machine-learning or document-understanding models.
Google’s current Document AI documentation describes layout parsing that identifies elements such as tables, lists, headings, and other structural content while preserving contextual relationships.
The important point is that table extraction is a structured-data problem, not simply a text-recognition problem.
Can OCR Extract Tables Directly to CSV?
OCR itself may only return recognized text.
The conversion to CSV usually requires an additional step.
For example:
Image
↓
OCR
↓
Recognized text + positions
↓
Table detection
↓
Rows and columns
↓
CSV
The final CSV might look like:
Product,Quantity,Price
Laptop,2,800
Mouse,5,15
Keyboard,3,40
This separation explains why two tools using the same OCR engine can produce very different spreadsheet results.
One tool may simply export the recognized text.
Another may perform additional layout analysis and restructuring before generating the CSV.
Can OCR Extract Tables to Excel?
Yes, but again, OCR alone is not necessarily enough.
Excel requires the extracted information to be placed into cells.
For example:
| Product | Quantity | Price |
|---|---|---|
| Laptop | 2 | 800 |
| Mouse | 5 | 15 |
| Keyboard | 3 | 40 |
A complete image-to-Excel workflow therefore needs to transform recognized text into a two-dimensional structure.
That process may involve:
- OCR
- layout detection
- table identification
- row detection
- column detection
- cell assignment
- data cleanup
- spreadsheet generation
This is why an image-to-Excel converter can produce a very different result from a basic image-to-text OCR tool.
Learn more in How to Convert Image to Excel.
Common Reasons Table Extraction Fails
Even advanced table extraction is not guaranteed to work perfectly.
Some common causes include:
Low-resolution images
Small or blurry characters are harder to recognize and position correctly.
Poor lighting
Shadows and glare can interfere with text and table boundaries.
Skewed photographs
Perspective distortion can make rows and columns harder to align.
Complex layouts
Multiple tables or text blocks on the same page can confuse structure detection.
Merged cells
Spanning cells do not fit neatly into a simple rectangular grid.
Handwritten entries
Handwriting can have inconsistent shapes and spacing.
Broken table borders
Missing or damaged lines can make cell boundaries harder to determine.
Decorative layouts
Reports and brochures may visually resemble tables without following a regular grid.
Multiple languages
Different scripts can require appropriate language recognition support.
For multilingual documents, see OCR Language Support.
How to Improve Table Extraction Accuracy
You can often improve the result before uploading the image.
Use a clear image
Higher-quality source images generally give OCR systems more usable visual information.
Keep the document straight
Avoid photographing a document from a steep angle.
Avoid shadows
Make sure lighting is reasonably even across the page.
Crop unnecessary content
If possible, remove unrelated background areas around the table.
Use the correct language
For multilingual documents, select or configure the appropriate language support when the OCR system provides that option.
Check the output
Even good OCR and table-detection systems can make mistakes. Always review important financial, accounting, medical, or business data before using it.
For more detailed image-preparation techniques, read How to Improve OCR Accuracy.
Table Detection vs Text Extraction
The easiest way to remember the difference is:
Text extraction asks:
What does the image say?
Table extraction asks:
What does the image say, and where does each piece of information belong?
For example:
Text extraction
Laptop 2 $800
Mouse 5 $15
Keyboard 3 $40
Table extraction
Product,Quantity,Price
Laptop,2,800
Mouse,5,15
Keyboard,3,40
The second output contains more structural information.
That structure is what makes the data useful for spreadsheets, databases, analytics, and automated workflows.
The Simple Table OCR Workflow
A typical image-to-table process can be understood as:
1. Upload image
The system receives a scanned document, photograph, screenshot, receipt, or other image.
2. Preprocess image
The image may be resized, deskewed, sharpened, or otherwise prepared.
3. Recognize text
OCR identifies characters, words, and numbers.
4. Analyze layout
The system considers where the recognized content appears on the page.
5. Detect the table
It identifies the region that appears to contain tabular information.
6. Detect rows and columns
The system groups content according to its spatial relationships.
7. Reconstruct cells
Text is assigned to the appropriate row and column.
8. Export structured data
The result can then be converted into CSV, Excel, or another structured format.
This general workflow explains why modern table extraction tools combine OCR with additional layout or document-understanding techniques.
What Makes a Good Image-to-Table Converter?
If your goal is to extract tables rather than simply copy text, look for a tool that can handle:
- printed tables
- borderless tables
- multiple columns
- merged cells
- irregular layouts
- receipts
- invoices
- scanned documents
- multiple images
- CSV export
- Excel export
- relevant language support
The most important question is not simply:
“Does this tool support OCR?”
Instead ask:
“Can it preserve the structure of the table I need to extract?”
That is the difference between getting text and getting usable data.
Final Takeaway
OCR is responsible for recognizing the words and numbers inside an image.
Table extraction goes one step further.
It uses text recognition together with positional and layout information to determine:
- where the table is
- where rows begin and end
- where columns are located
- which text belongs to each cell
- which cells are headers
- whether cells span multiple rows or columns
This is why extracting a table from an image is more complicated than simply converting an image to text.
If your final goal is CSV or Excel, the quality of the structure reconstruction matters just as much as the quality of OCR.
For simple documents, basic OCR may be enough.
For invoices, receipts, financial tables, forms, and complex scanned documents, a table-aware extraction workflow can be much more useful.
Related Guides
- Why OCR Fails on Tables and How to Fix It
- How to Improve OCR Accuracy
- How to Convert Image to Excel
- Convert Image to CSV Online Free
- OCR Language Support
- Scan Receipts to Excel Automatically
Extract a Table From an Image
Need to turn an image-based table into usable spreadsheet data?
Upload the image and convert it to CSV or Excel.
📊 Extract Table Data From an Image
Convert image-based tables into structured CSV or Excel data.
Extract Table Now →